UCA leads with data to effectively communicate the story of Urgent Care and its unparalleled impact, value, and contributions to the healthcare landscape.

Patients cared for in an Urgent Care setting each year
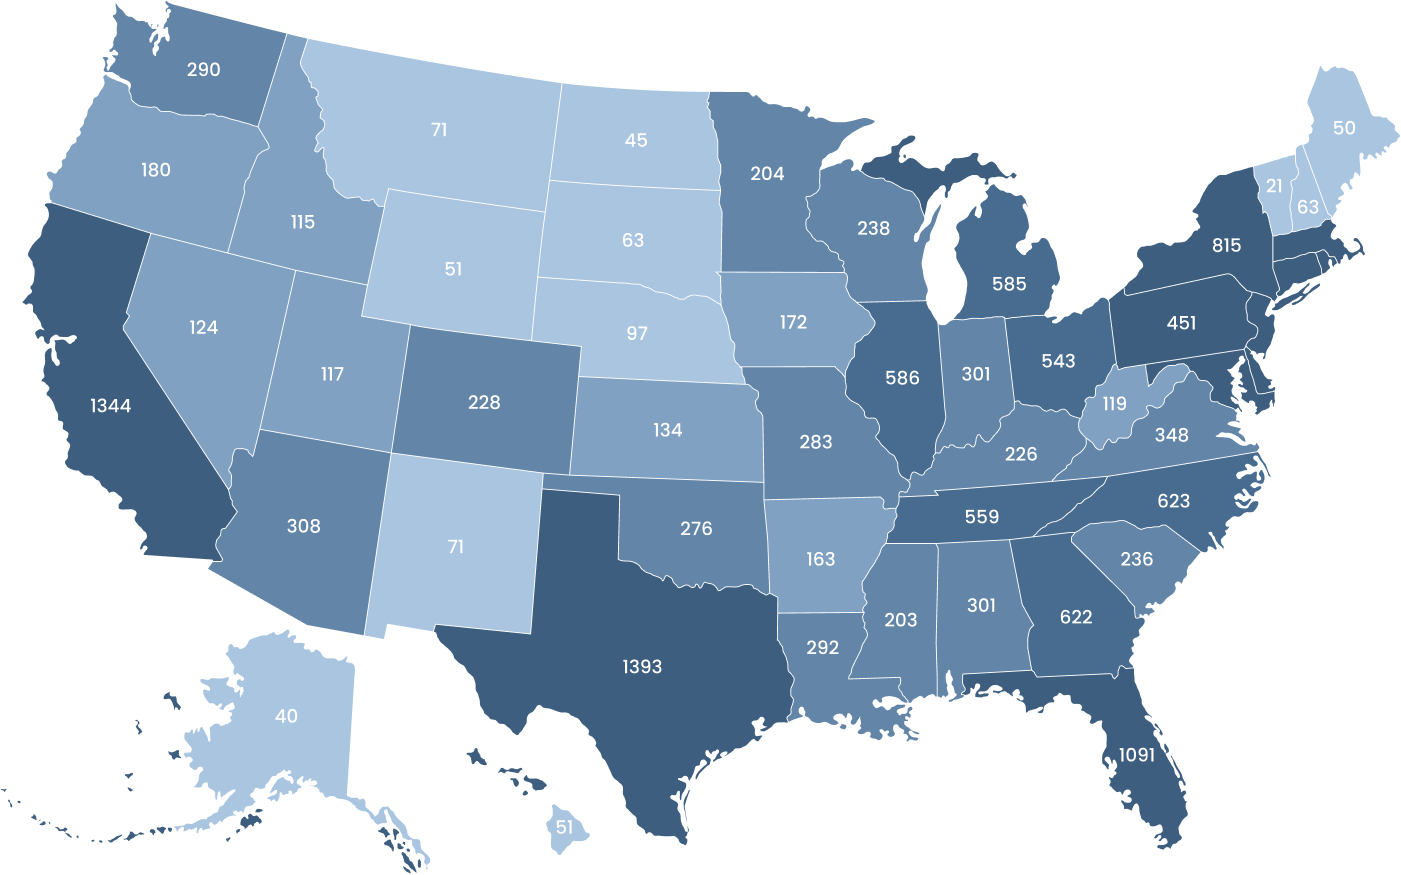
From 2016 to 2024, Urgent Care Centers have grown from 9,000 to 15,000.
The map represents open centers by state since January 2026.
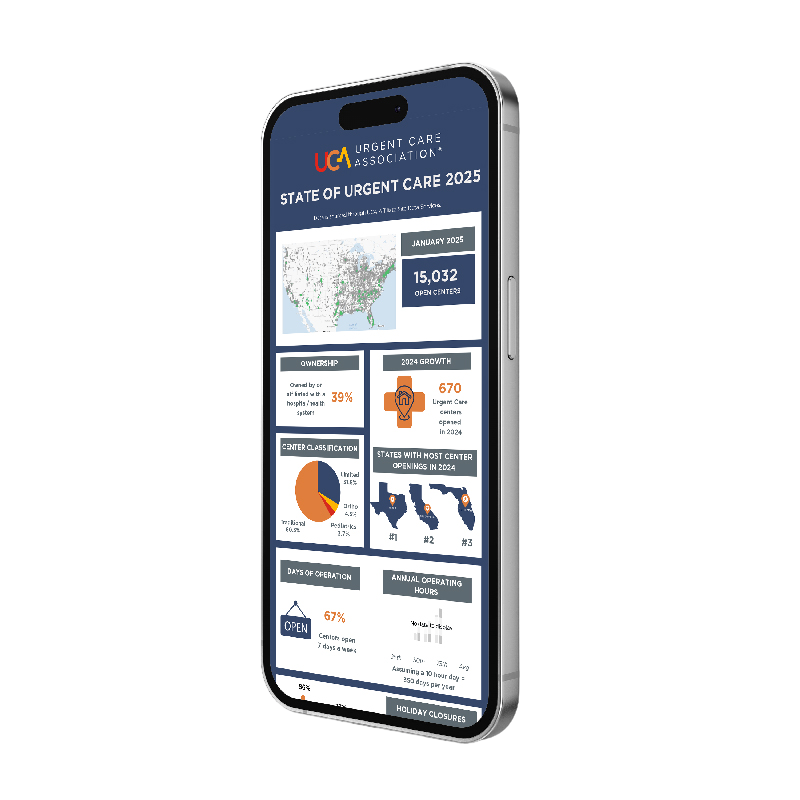
This dynamic visual resource highlights 2024’s clinic openings, the top states for new centers, hospital affiliations, hours of operation and more!
This is the perfect way to stay up to date. Fill out the form below to receive your free copy.
Classification based on USDA Rural–Urban Commuting Area (RUCA) Codes.
Rural (RUCA 10)
62.8% of visits are children, teens, and adults under 40
11-20
15.3%
21-30
17.4%
31-40
15.8%
41-50
11.8%
51 – 60
10.1%
61 – 70
8.3%
71-80
5%
81+
2%
Source: JUCM.com

Source: ER waits by state (demo) | CareTransparency
Source: Experity Data
The Essential Nature of Urgent Card in the Healthcare Ecosystem Post-Covid-19

Independent Private
UCA Member Survey

Hospital-Owned
UCA Member Survey
The link contains rankings of the largest/top 50 operators that are owned by or affiliated with a hospital, largest/top 50 independent operators, and center counts by state.
33.13 avg. patients/day/center
33.27 avg. patients/day/center
1
2
Metropolitan high commuting — 30%+ primary commuting flow to a metro UA
3
Metropolitan low commuting — 10–30% primary commuting flow to a metro UA
4
Micropolitan core — primary commuting flow within a UA of 10,000–49,999
5
Micropolitan high commuting — 30%+ flow to a micro UA
6
Micropolitan low commuting — 10–30% flow to a micro UA
7
Small town core — primary commuting flow within a UA of 9,999 or fewer (small town UA)
8
Small town high commuting — 30%+ flow to a small town UA
9
Small town low commuting — 10–30% primary commuting flow to a small town UA
10
Rural areas — primary commuting flow to a tract outside
an UA
