UCA leads with data to effectively communicate the story of Urgent Care and its unparalleled impact, value, and contributions to the healthcare landscape.

Patients cared for in an Urgent Care setting each year


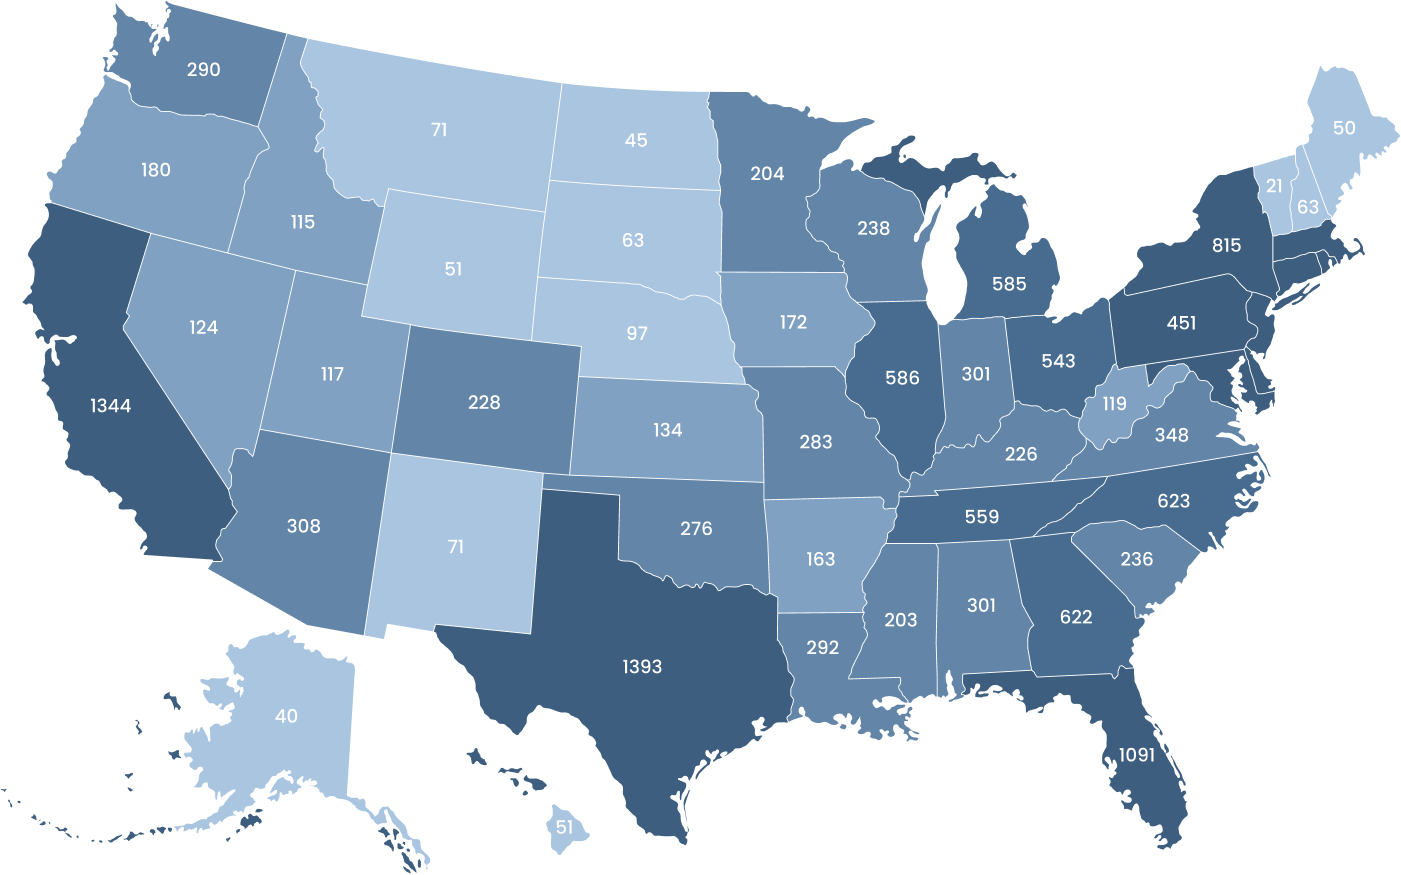
From 2016 to 2024, Urgent Cares have grown from 9,000 to 15,000.
The map represents open centers by state since January 2026.
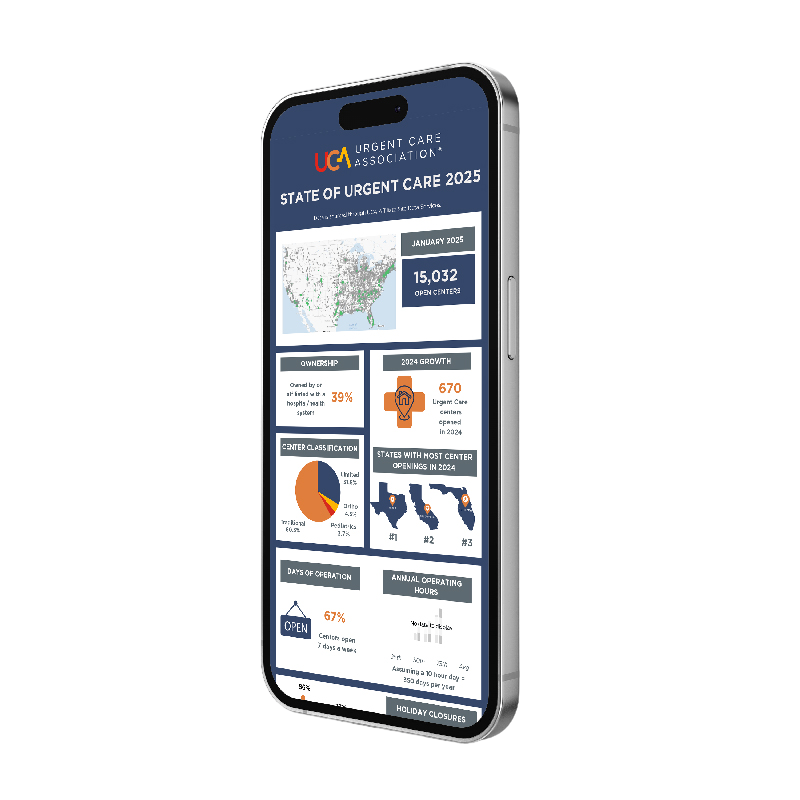
This dynamic visual resource highlights 2025’s Urgent Care openings, the top states for new Urgent Cares, hospital affiliations, hours of operation and more!

Get exclusive access to this comprehensive State of the Union paper for Urgent Care, featuring insights, challenges, and opportunities shaping the future of Urgent Care.
Expert insights from Dean Hutchison (National Urgent Care Realty) in this three-part monthly series (June, July, August) on how the Urgent Care footprint is evolving across the United States and what it means for access and growth.
Classification based on USDA Rural–Urban Commuting Area (RUCA) Codes.
Rural (RUCA 10)
62.8% of visits are children, teens, and adults under 40
Source: JUCM.com
The vast majority of Americans have an Urgent Care within a short drive, making Urgent Care one of the most geographically accessible points of care in the U.S. healthcare system.

Source: UCA Member Survey

Source: ER waits by state
150 minutes
Median ED Wait Time

Source: Experity Data
56 minutes
Average UC Visit Time
5,000,000+ UC Visits “After Hours”
Based on survey of 13,000,000 patient encounters after 5 p.m., Jan – March 2024
No Data Found
In 2019, 34% of ED presentations were inappropriate. A significant share of emergency department visits involve conditions that could be safely and efficiently treated at an Urgent Care, at a fraction of the cost and wait time.
Source: Advisory Board, 2023
No Data Found
Source: Site Data Services
No Data Found
Source: Site Data Services
View and download data tables with rankings of the top 50 hospital-affiliated operators, the top 50 independent operators, and center counts by state.
33.27 avg. patients/day/center
1
2
Metropolitan high commuting — 30%+ primary commuting flow to a metro UA
3
Metropolitan low commuting — 10–30% primary commuting flow to a metro UA
4
Micropolitan core — primary commuting flow within a UA of 10,000–49,999
5
Micropolitan high commuting — 30%+ flow to a micro UA
6
Micropolitan low commuting — 10–30% flow to a micro UA
7
Small town core — primary commuting flow within a UA of 9,999 or fewer (small town UA)
8
Small town high commuting — 30%+ flow to a small town UA
9
Small town low commuting — 10–30% primary commuting flow to a small town UA
10
Rural areas — primary commuting flow to a tract outside
an UA